One question that comes up often as more and more I/O heavy server workloads are migrated to virtual servers is how can I verify I/O performance pre and post migration? While there are a number a methods, I have written this to demonstrate one possible way to run test scenarios on a physical server and then verify them after you have converted it to a virtual server.
IOmeter can be used to both generate and measure I/O load on Disk and Network subsystems. IOmeter can measure network throughput from one VM to another. This is helpful when you are determining whether to put two VMs on the same vSwitch, on separate vSwitches or add additional uplinks. In a virtual environment IOmeter can come in handy to benchmark across different SAN environments and networking configurations. For benchmarking, this section will focus on Disk I/O. For example, IOmeter can be configured to benchmark within a virtual machine to run a disk I/O test while it is sitting on an NFS file system. This test can be saved and then re-run from a different storage system such as FC or iSCSI disk storage. (Note: Additional information on IOmeter is available from iometer.org)
Install IOmeterIometer can be downloaded and installed from IOmeter.org. Install it on the physical server you want to measure I/O on | |
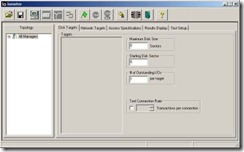
| Open IOmeter and expand the All Managers in the Topology Screen to ensure the server is listed with the default workers | |
| Click the Disk Targets and select the drive. An x will appear in the box. (Note a red slash appears across the drive because there is no logfile however it is created automatically after you run the first test) | |
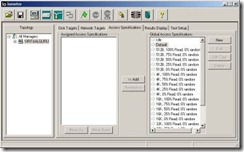
| Click the Access Specifications and double click the default under Global Access Specifications | |
| Any of these parameters can be changed such as Reads vs. Writes or randomization however you must put something in the Transfer Request Size to generate I/O. | |
| Assign the Default Access Specification by clicking Add | |
| Click the Results Page and Drag the computer icon (VIRTUALGURU in the example) onto the Total I/O per Second raised tab. | |
| The Total I/O per Second should now display the computer name instead of All Managers | |
| Click the Green Flag to start the test and select Save when prompted to save the results file | |
| Ensure you are now getting Display results | |
| By clicking the Greater than sign or arrow at the end of the Total I/O per Second progress bar you can display the results graphically | |
Once completed, click the stop sign from the menu. You can save this configuration using the save button from the menu and re-open it by clicking the open file option from the menu. To determine relative performance run the same configuration tests after the server is P2V’d into the virtual environment. If you have different tiers of storage in your SAN environment run the tests multiple times from different volumes. You may have to go back and re-adjust the Access Specifications again before you get good comparisons.


I can not believe there is no comments on this. Apparently not only does Mr. O'Doherty have a great grasp on benchmarking but also a time machine because this post dated 2010 is imo totally more relevant in 2012.
ReplyDelete